If you've hit this blog before you may realize I think Origin is a TERRIBLE piece of software to use. I have resolved to become proficient with it since there is a license available to me and my boss uses it exclusively. All I have to say is thank god I'm using LaTeX for most of my pubs because as far as I can tell Origin still gives you the middle finger if you want predictable results in MS Word. Anyway...here are the settings and steps that seem to work best for me
Open Origin and click on Tools>Options


Once you have a graph started under Format>Page


*UPDATE* one more thing...it seems that if you make graphs on different computers one more setting should be changed to ensure they are standardized. I think the disparity might be with the printer settings on different computers. The layer location on the graph needs to be manually set. Use
 This seems to center the figure vertically well.
This is for a B&W publication that will fit 2 graphs horizontally for standard margins. Leave the rest alone
Then since I use LaTeX, you must export them into .eps so
File>Export
 be sure Margin Control is on Page. That's important for all the axis to line up.
*UPDATE* Because Origin's terrible programming, it is important to export ONE GRAPH AT A TIME! Doing multiple exports at once can shift the position of labels and axis of the output file so that subfigures won't align properly. That was an hour of my life I'll never get back...thanks Origin. Good one :(
*UPDATE x2* Ok, amending some of the settings above to maximize the figure area. Set the page to 3.13 x 2 and then the layer dimensions look like
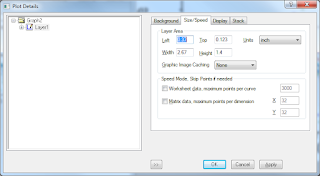
then make the axis major ticks to be 3pts. This will make the axis labels fill the entire page when the scales are as small as -9999 (4 characters from the edge of the axis to the edge of the page) for both x and y.
Then in LaTeX the command will look something like
% PRESSURE FIGURES
%===============================================================================================
\begin{figure}
% Requires \usepackage{graphicx}
\centering % centers everything on the page
\subfigure[]
{
\includegraphics[width=3.13in, height=1.75in]{Final_Figures/Pressure_dpdr}% include figure
\label{Fig. SubSec: Pressure_dpdr}
}
\subfigure[]
{
\includegraphics[width=3.13in, height=1.75in]{Final_Figures/Pressure_P}% include figure
\label{Fig. SubSec: Pressure_P}
}
\caption{Variation with vortex Reynolds number of \ref{Fig. SubSec: Pressure_dpdr} the radial derivative of pressure and \ref{Fig. SubSec: Pressure_P}. $\kappa=0.103$ for all plots.} % text to be included under all figures
\label{Fig. SubSec: Pressure}
\end{figure}
%===============================================================================================
1 comment:
Hey Josh, I've always exported multiple graphs in Origin 8.0 and never had this issue. Maybe there's something wrong with the template that you are using. Also, try unchecking "Center Multi Line" from the text properties. It used to cause the text to change position during export in some graphs I had. Also, try using Print View mode in the View Mode of your Plot Details and see if that makes any difference.
Post a Comment